Introduction
soroban’s treeModule generates Decision
tree.
In this article, we’ll use TeachingRatings dataset of AER
This article is based on 0.0.1 Version of soroban
Declare module
soroban’s module assumes that used in the Shiny application.
and You can use snippet(type shinyapp) to build very
basic shiny application.
library(shiny)

ui <- fluidPage(

)

server <- function(input, output, session) {

}

shinyApp(ui, server)
This application will show nothing.
So let’s add treeModule in ui.
ui <- fluidPage(
  mod_treeModule_ui(
    id = 'module'
  )
)
also, treeModule in server.
server <- function(input, output, session) {
  mod_treeModule_server(
    id = 'module',
    inputData = reactive(TeachingRatings)
  )
}
So final (which is very basic) code will like this. (Assume data from
AER loaded.)
library(shiny)

ui <- fluidPage(
  mod_treeModule_ui(
    id = 'module'
  )
)

server <- function(input, output, session) {
  mod_treeModule_server(
    id = 'module',
    inputData = reactive(TeachingRatings)
  )
}

shinyApp(ui, server)
You should notice 2 things.
- both
idin ui and server should be same. -
inputDatain server should be format of reactive
Structure of treeModule

treeModule is consisted with Control Area and
Result Area
and below using flow.
- Declare module (we did already)
- select variable to generate tree. 2-1. (Optional) adjust tree layout
option like
EdgeandNode,Terminal of tree - build
Tree
Usage of treeModule
Using TeachingRatings, we’ll see which factor effects
teacher’s evaluation.
Set X as beauty, minority, age
,gender,division,native,tenure
(order is not important)
and Y as eval.
that is we want to model Evaluation with 7 factors
Also, the treeModule supports regression too.
select nodePlot options to beauty,
gender, minority (typo will fixed in further
version)

and after Tree, generated tree will be shown.
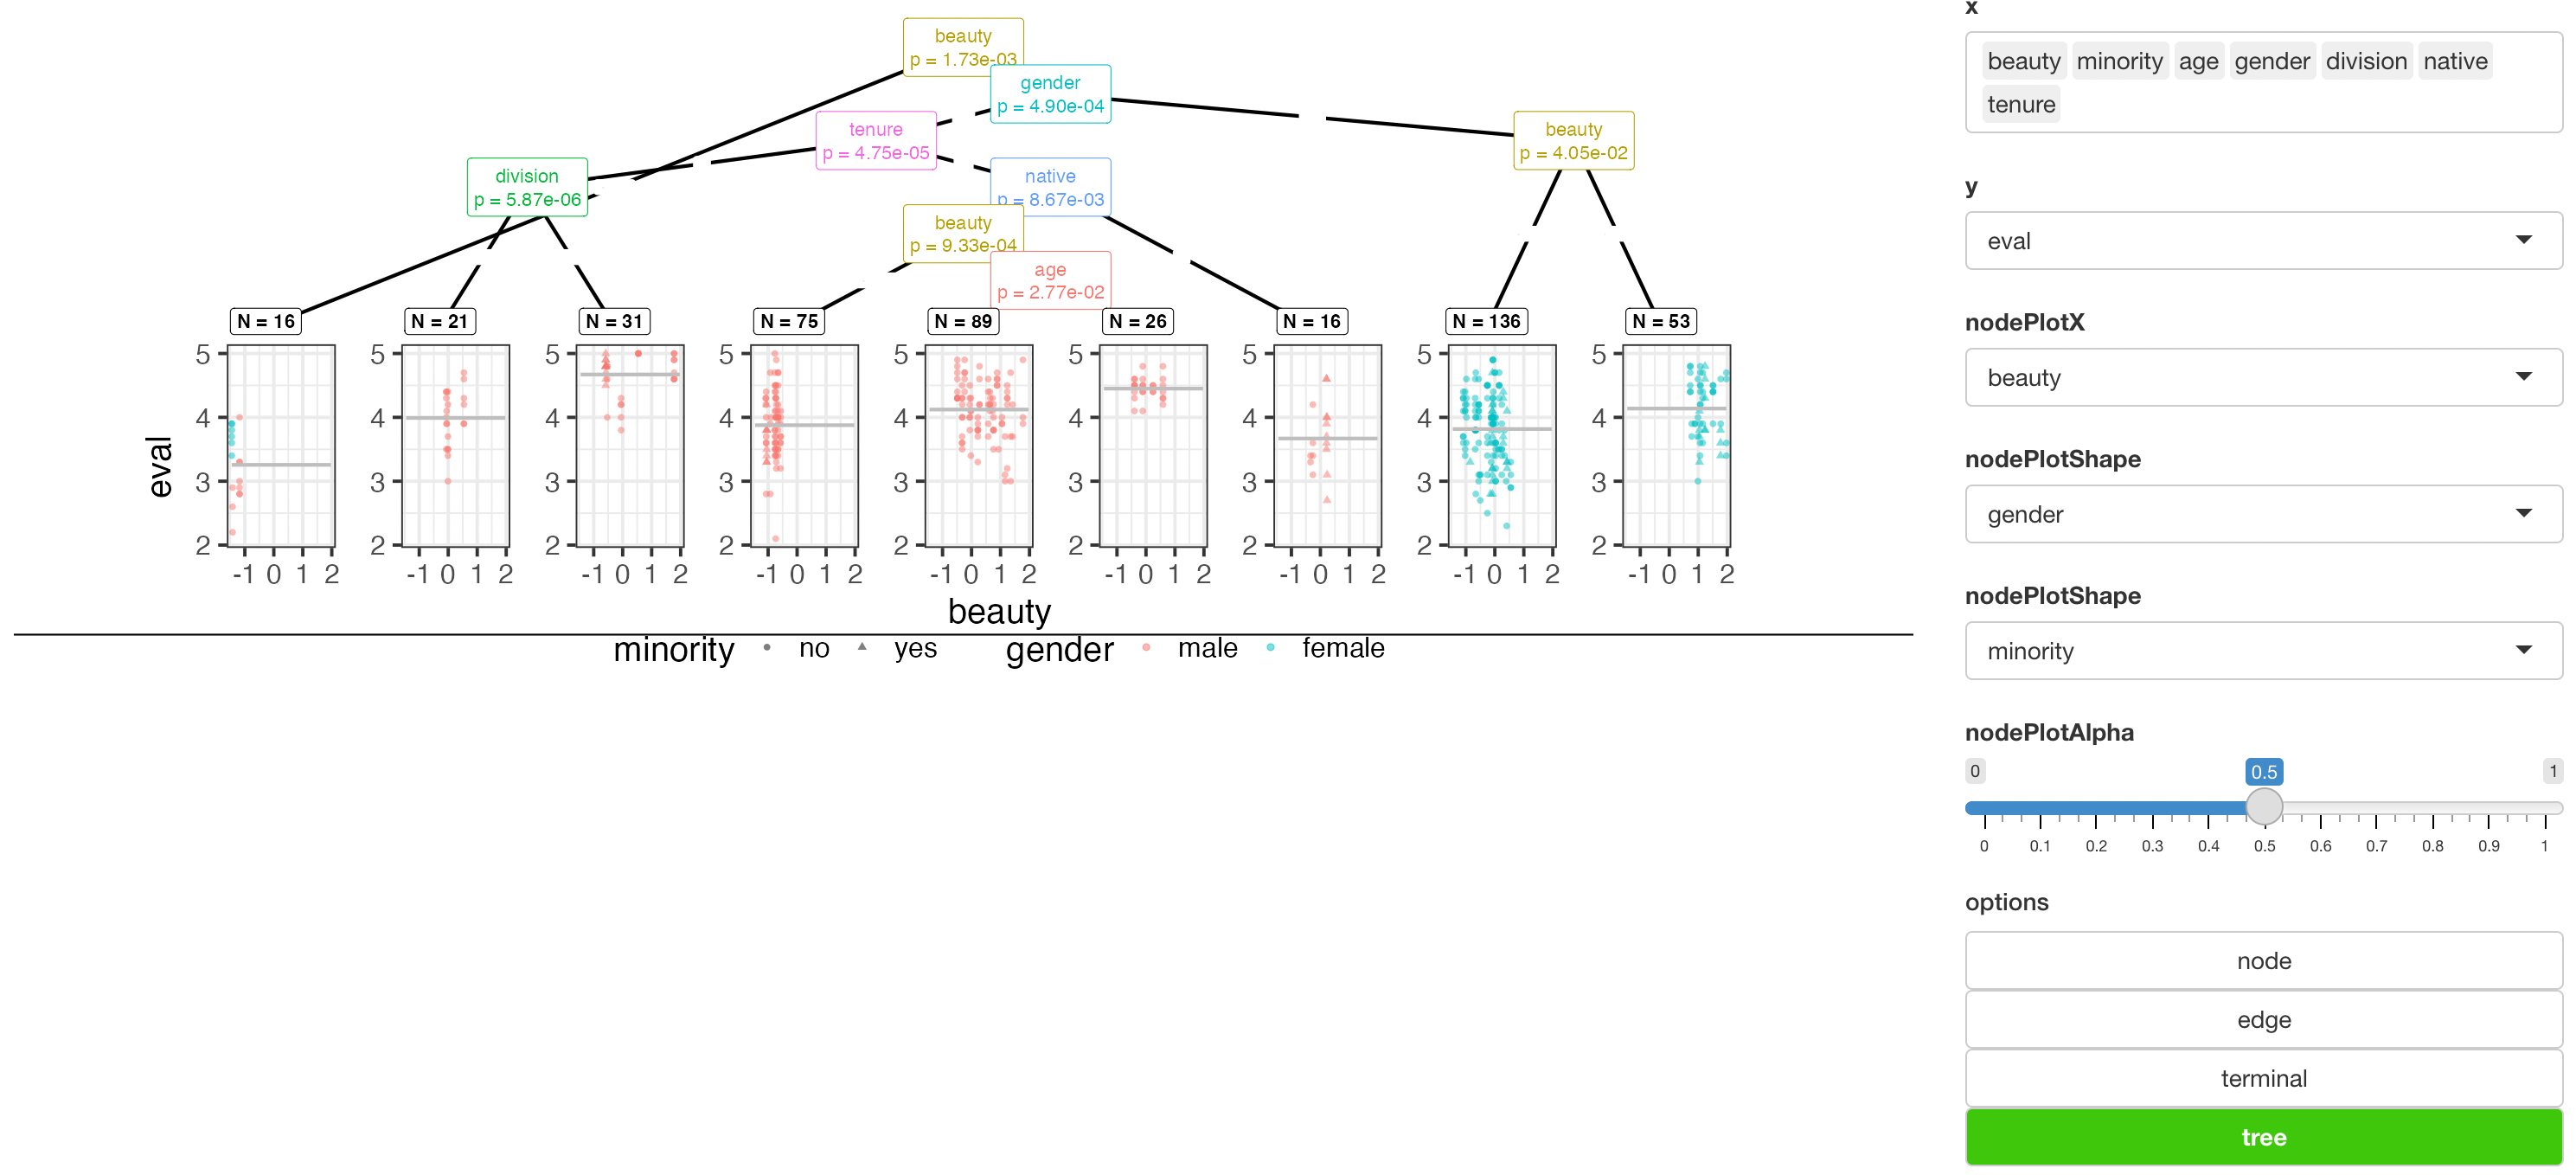
Result shows that, beauty and other factor’s effect to
teacher evaluation. and below scatter plot is regression for relation
between beauty and eval based on
gender.
(We consider change nodePlot option may not required in further version)
However if we change some character type value to factor, (which is more accurate) result will also changed.
For any issue or suggestion, please make issue in soroban’s github.