How to use groupStatModule
Source:vignettes/articles/usage-groupStat-Module.Rmd
usage-groupStat-Module.RmdIntroduction
soroban’s groupStatModule performs Aggregation.
In this article, we’ll use scholarship dataset of datatoys
This article is based on 0.0.1 Version of soroban
Declare module
soroban’s module assumes that used in the Shiny application.
and You can use snippet(type shinyapp) to build very
basic shiny application.
library(shiny)

ui <- fluidPage(

)

server <- function(input, output, session) {

}

shinyApp(ui, server)
This application will show nothing.
So let’s add treeModule in ui.
ui <- fluidPage(
  mod_groupStatModule_ui(
    id = 'module'
  )
)
also, treeModule in server.
server <- function(input, output, session) {
  mod_groupStatModule_server(
    id = 'module',
    inputData = reactive(datatoys::scholarship)
  )
}
So final (which is very basic) code will like this. (Assume data from
AER loaded.)
library(shiny)

ui <- fluidPage(
  mod_groupStatModule_ui(
    id = 'module'
  )
)

server <- function(input, output, session) {
  mod_groupStatModule_server(
    id = 'module',
    inputData = reactive(datatoys::scholarship)
  )
}

shinyApp(ui, server) # Run application
You should notice 2 things.
- both
idin ui and server should be same. -
inputDatain server should be format of reactive
Structure of treeModule
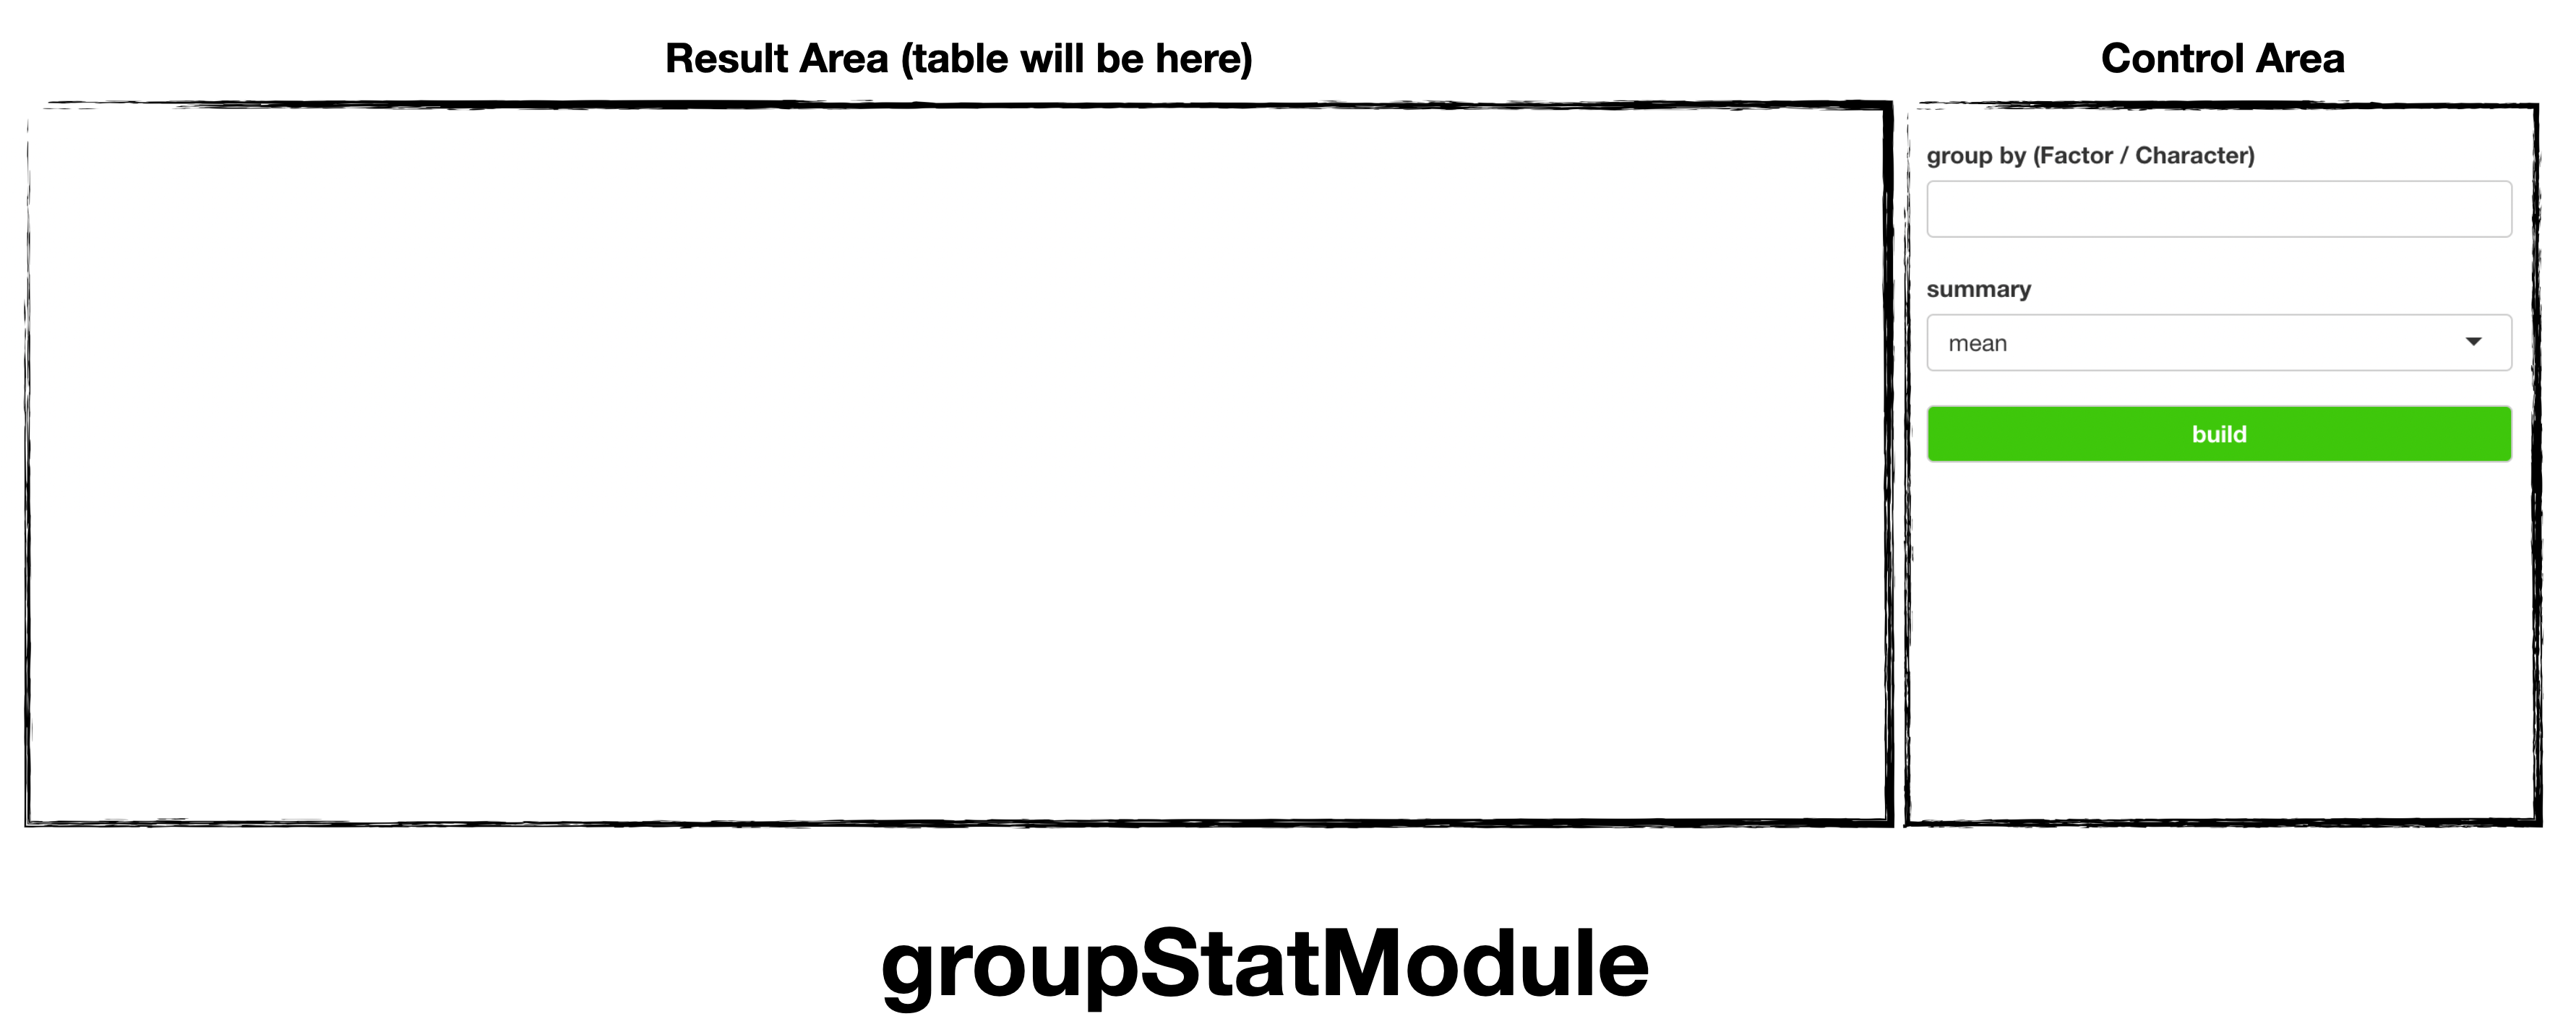
groupStatModule is consisted with Control Area and
Result Area
and below using flow.
- Declare module (we did already)
- Select
groupandsummarymetric. build
Usage of groupStatModule
Using scholarship, we’ll see summary metric by catetory
of university.
Set group by as 학제별 and
summary as mean.
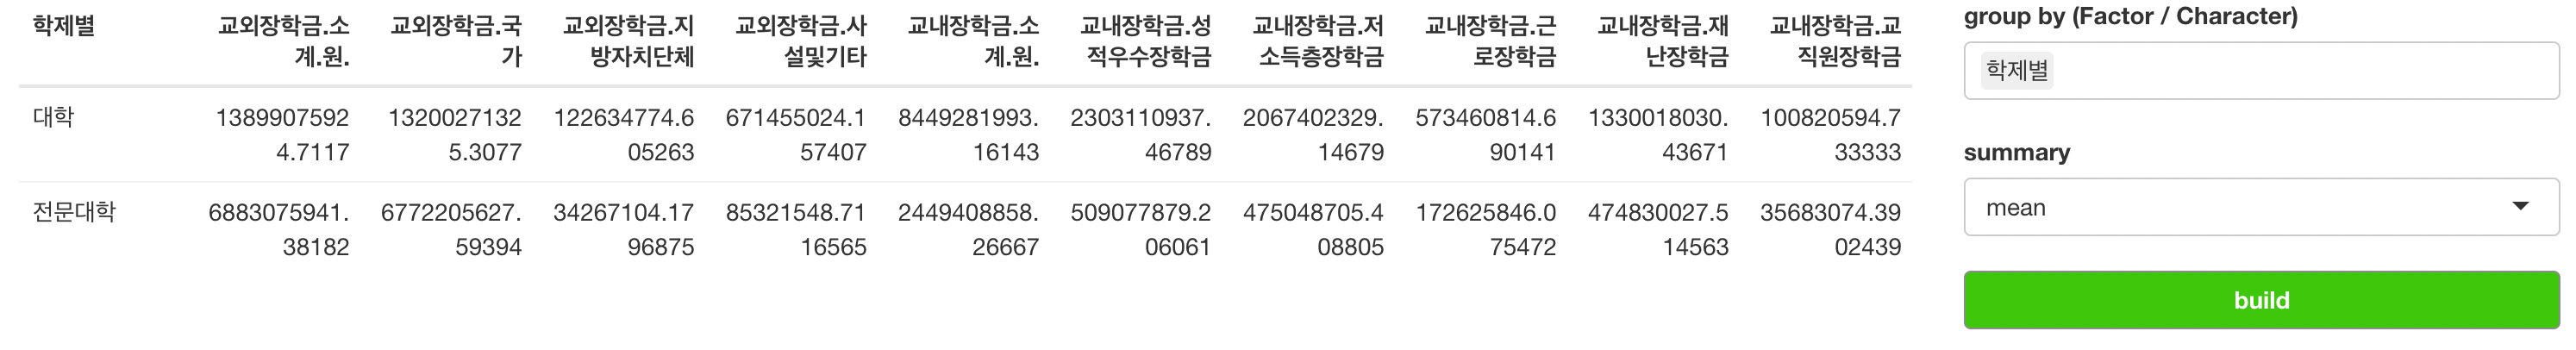
this result shows that.
university with category 대학 (university), their
average scholarship (교외장학금) will be near 13.9 Billion.
and university with category 전문대학 (college), their
average scholarship will be near 6.8 Billion. (almost X2)
- groupStatModule supports multiple group. that is not only
학제별, other options can be choose.
For any issue or suggestion, please make issue in soroban’s github.