How to use pairmodule
Source:vignettes/articles/usage-pairplot-module.Rmd
usage-pairplot-module.Rmd
library(colorpen)
#> Warning: replacing previous import 'ggplot2::last_plot' by 'plotly::last_plot'
#> when loading 'colorpen'
Introduction
colorpen’s pairModule uses GGally to
visualize pair-level plot.
In this article, we’ll use mtcars dataset.
This article is based on 0.0.4 Version.
Declare module
colorpen’s module assumes that used in the Shiny application.
and You can use snippet(type shinyapp) to build very
basic shiny application.
library(shiny)

ui <- fluidPage(

)

server <- function(input, output, session) {

}

shinyApp(ui, server)
This application will show nothing.
So let’s add pairModule in ui
ui <- fluidPage(
  mod_pairModule_ui('pairModule_1')
)
also, pairModule in server.
server <- function(input, output, session) {
  colorpen::mod_pairModule_server('pairModule_1', inputData)
}
Note that, we didn’t declare inputData yet.
So final (which is very basic) code will like this.
library(shiny)

ui <- fluidPage(
  mod_mapVisModule_ui(
    id = 'MapModule'
  )
)

server <- function(input, output, session) {
  inputData <- reactive({mtcars}) ## THIS CODE ADDED
  colorpen::mod_pairModule_server('pairModule_1', inputData)
}

shinyApp(ui, server) # run application
You should notice 2 things.
- both
idin ui and server should be same. -
inputDatain server should be format of reactive
Structure of pairModule
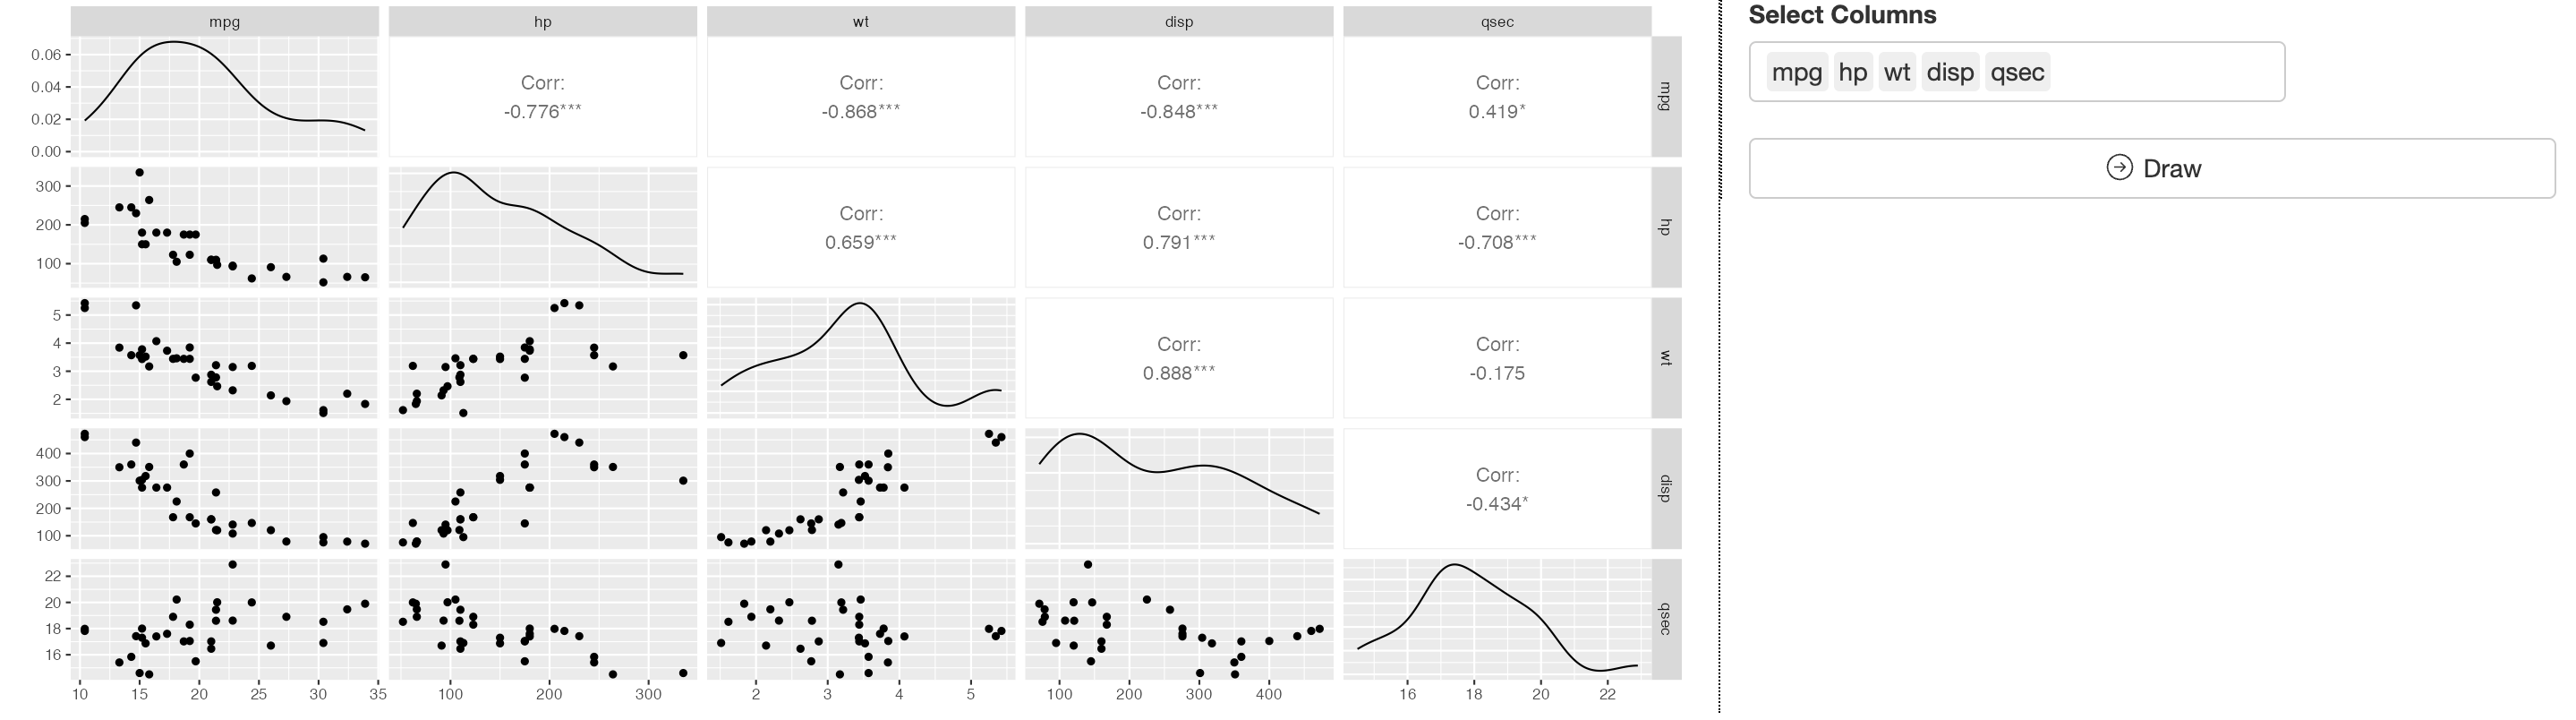
pairModule is consisted with Result Area and
Control Area
and below using flow.
- Declare module (we did already)
- Set columns of data to visualize
- Draw.
For more information about leaflet functions, visit this page.
For any issue or suggestion, please make issue in colorpen’s github.