build histogram from character input
Usage
distribute(i, xlabel = NULL)
Arguments
- i
vector of numeric data
- xlabel
label for x axis (default is value), y axis set as 'count'.
Value
histogram built with ggplot
Examples
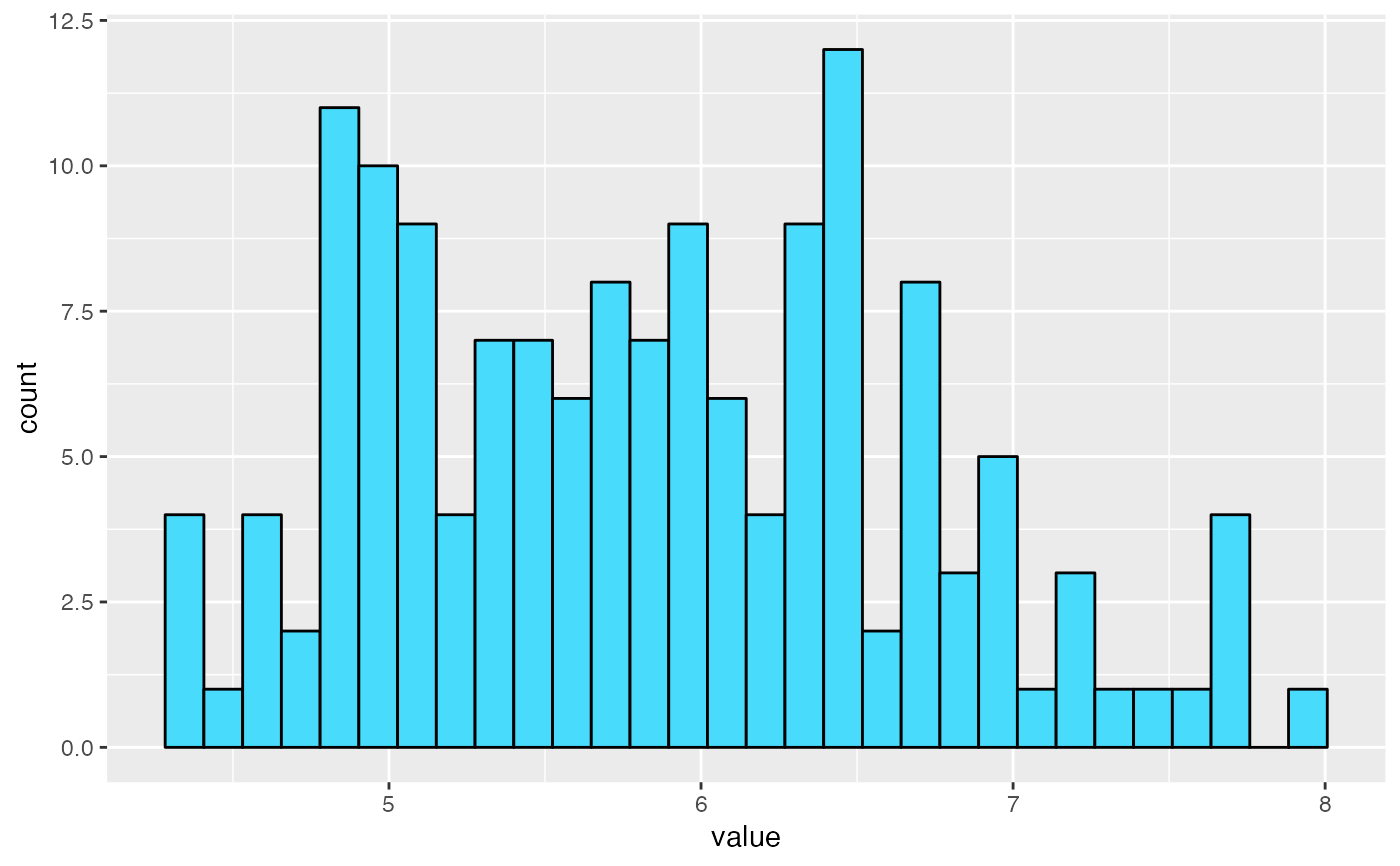
distribute(iris[,"Sepal.Width"])
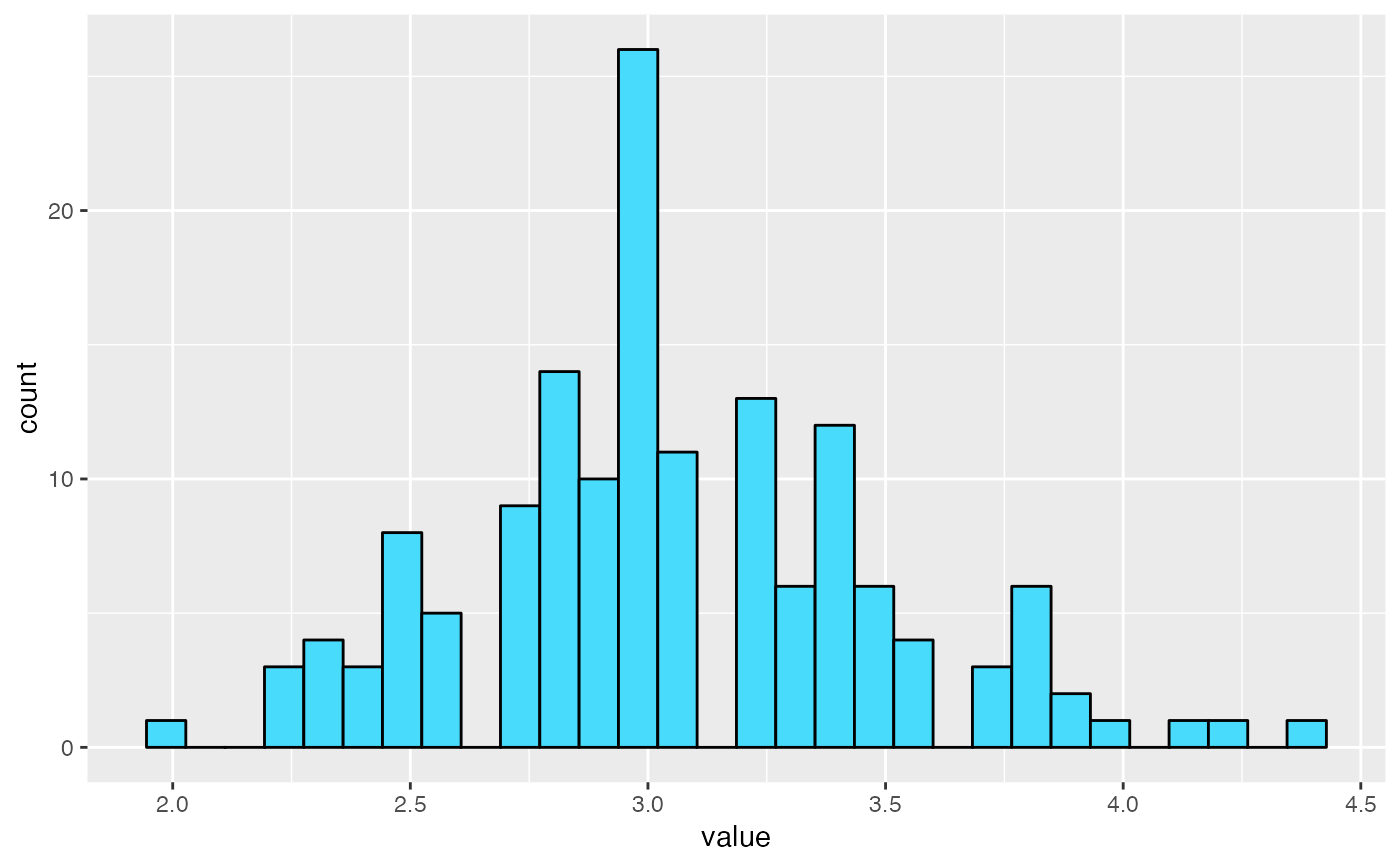 distribute(iris$Sepal.Length) # this will be work too.