How to use distributionModule
Source:vignettes/articles/usage-distribution-Module.Rmd
usage-distribution-Module.RmdIntroduction
board’s distributionModule shows selected
variables distribution (and additional information too)
In this article, we’ll use bloodTest dataset of datatoys
This article is based on 0.0.2 Version of board.
Declare module
board’s module assumes that used in the Shiny application.
and You can use snippet(type shinyapp) to build very
basic shiny application.
library(shiny)

ui <- fluidPage(

)

server <- function(input, output, session) {

}

shinyApp(ui, server)
This application will show nothing.
So let’s add distributionModule in
ui
ui <- fluidPage(
  mod_distributionModule_ui(
    id = 'distModule'
  )
)
also, distributionModule in server.
server <- function(input, output, session) {
  mod_distributionModule_server(
    id = 'distModule',
    inputData = reactive(datatoys::bloodTest)
  )
}
So final (which is very basic) code will like this.
library(shiny)

ui <- fluidPage(
  mod_distributionModule_ui(
    id = 'distModule'
  )
)

server <- function(input, output, session) {
  mod_distributionModule_server(
    id = 'distModule',
    inputData = reactive(datatoys::bloodTest) # remotes::install_github('statgarten/datatoys')
  )
}

shinyApp(ui, server) # run application
You should notice 2 things.
- both
idin ui and server should be same. -
inputDatain server should be format of reactive
Structure of distributionModule
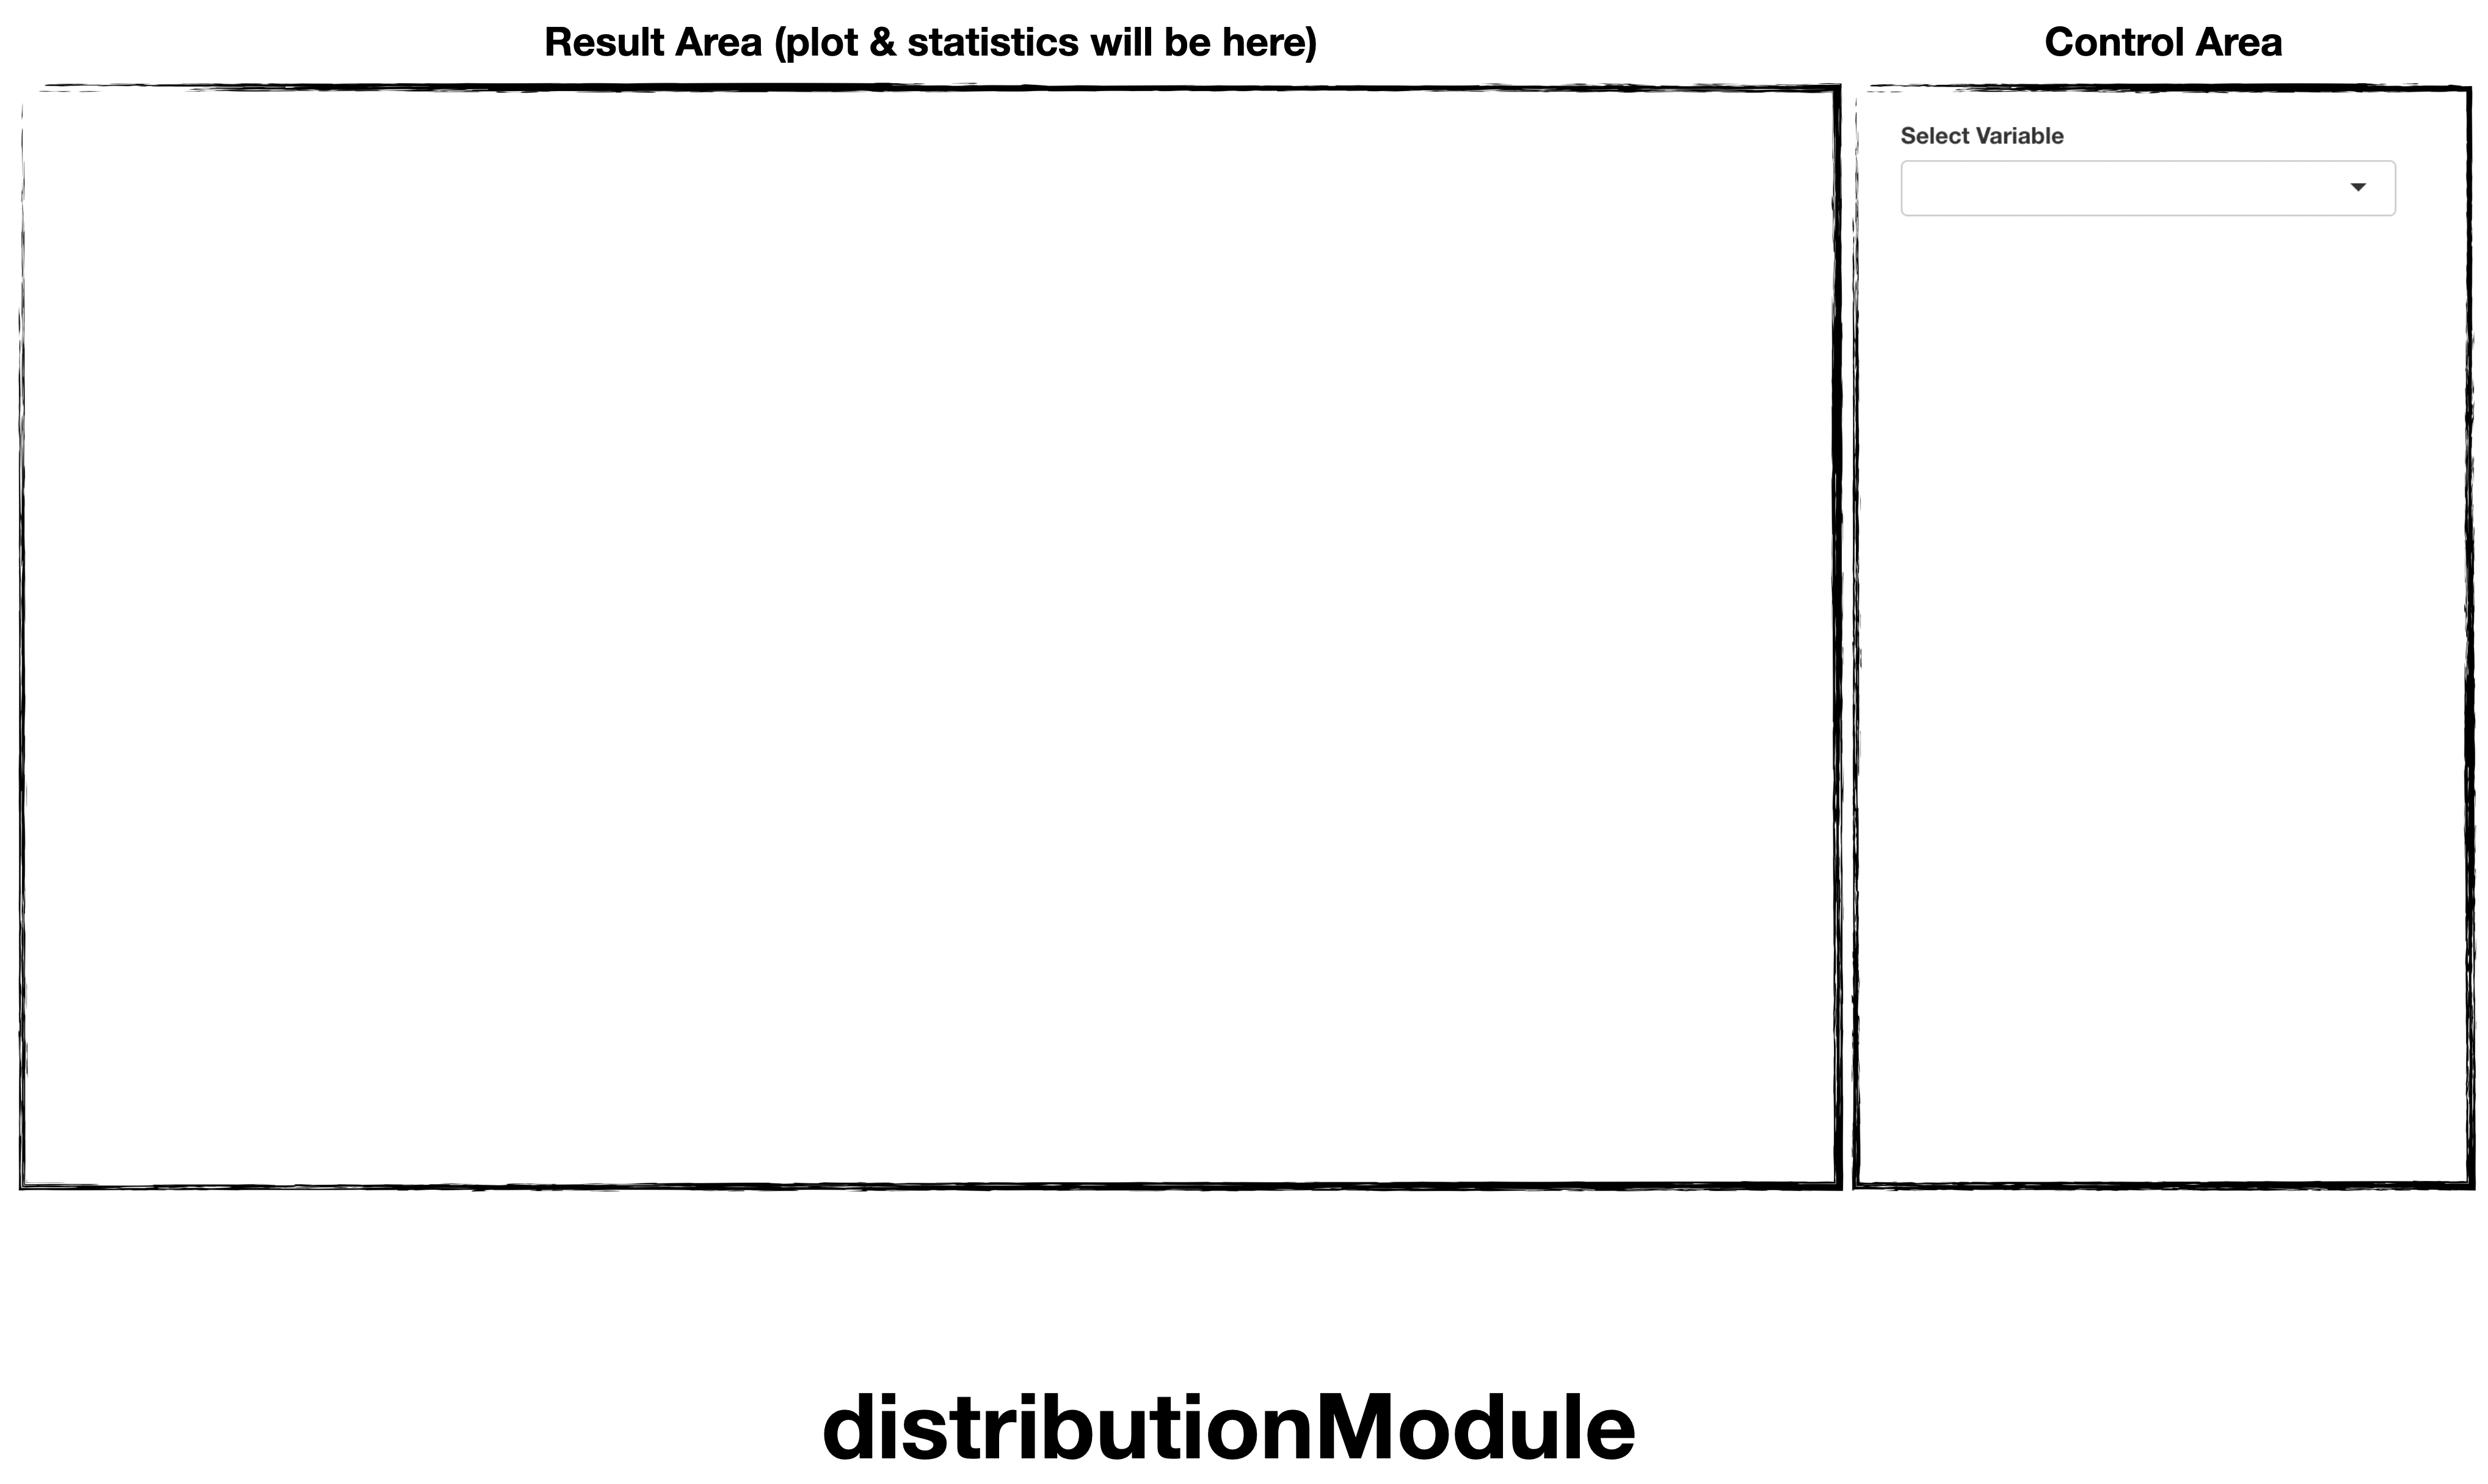
distributionModule is consisted with Result Area and
Control Area
and below using flow.
- Declare module (we did already)
- Set column to show distribution, and finish! (“reactive” result will shown)
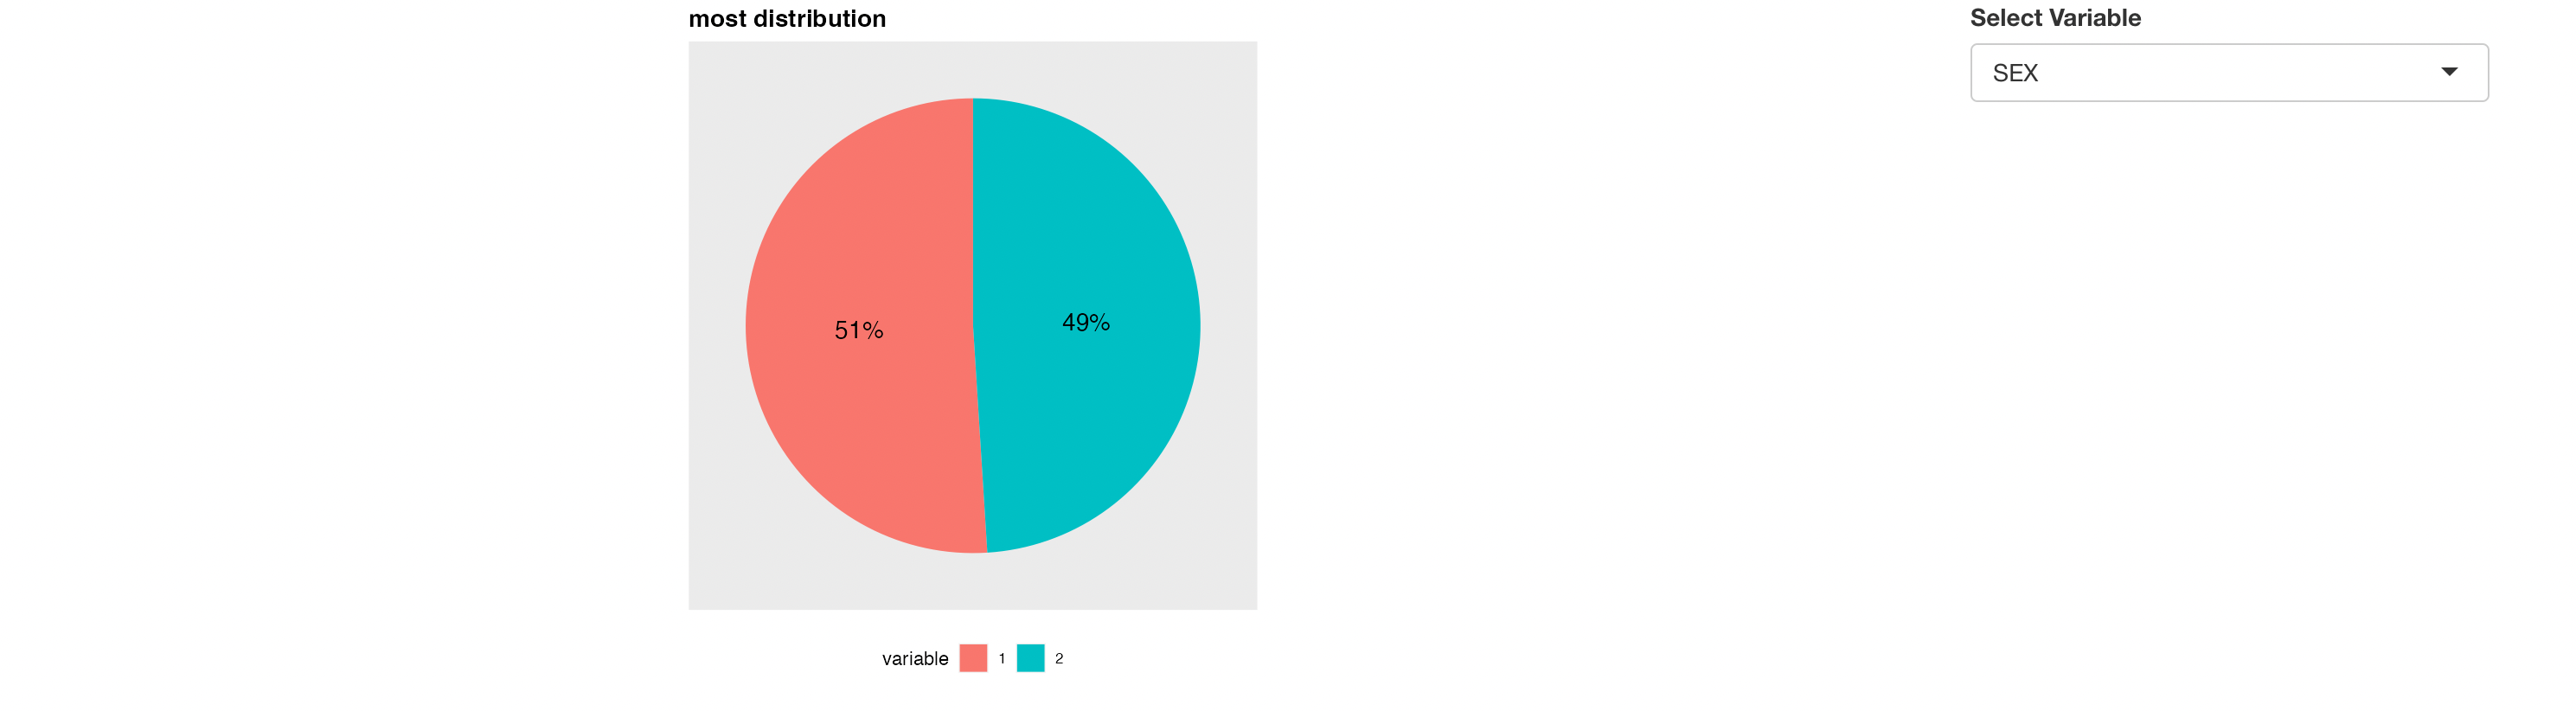
Usage of distributionModule
Let’s change Variable like image below
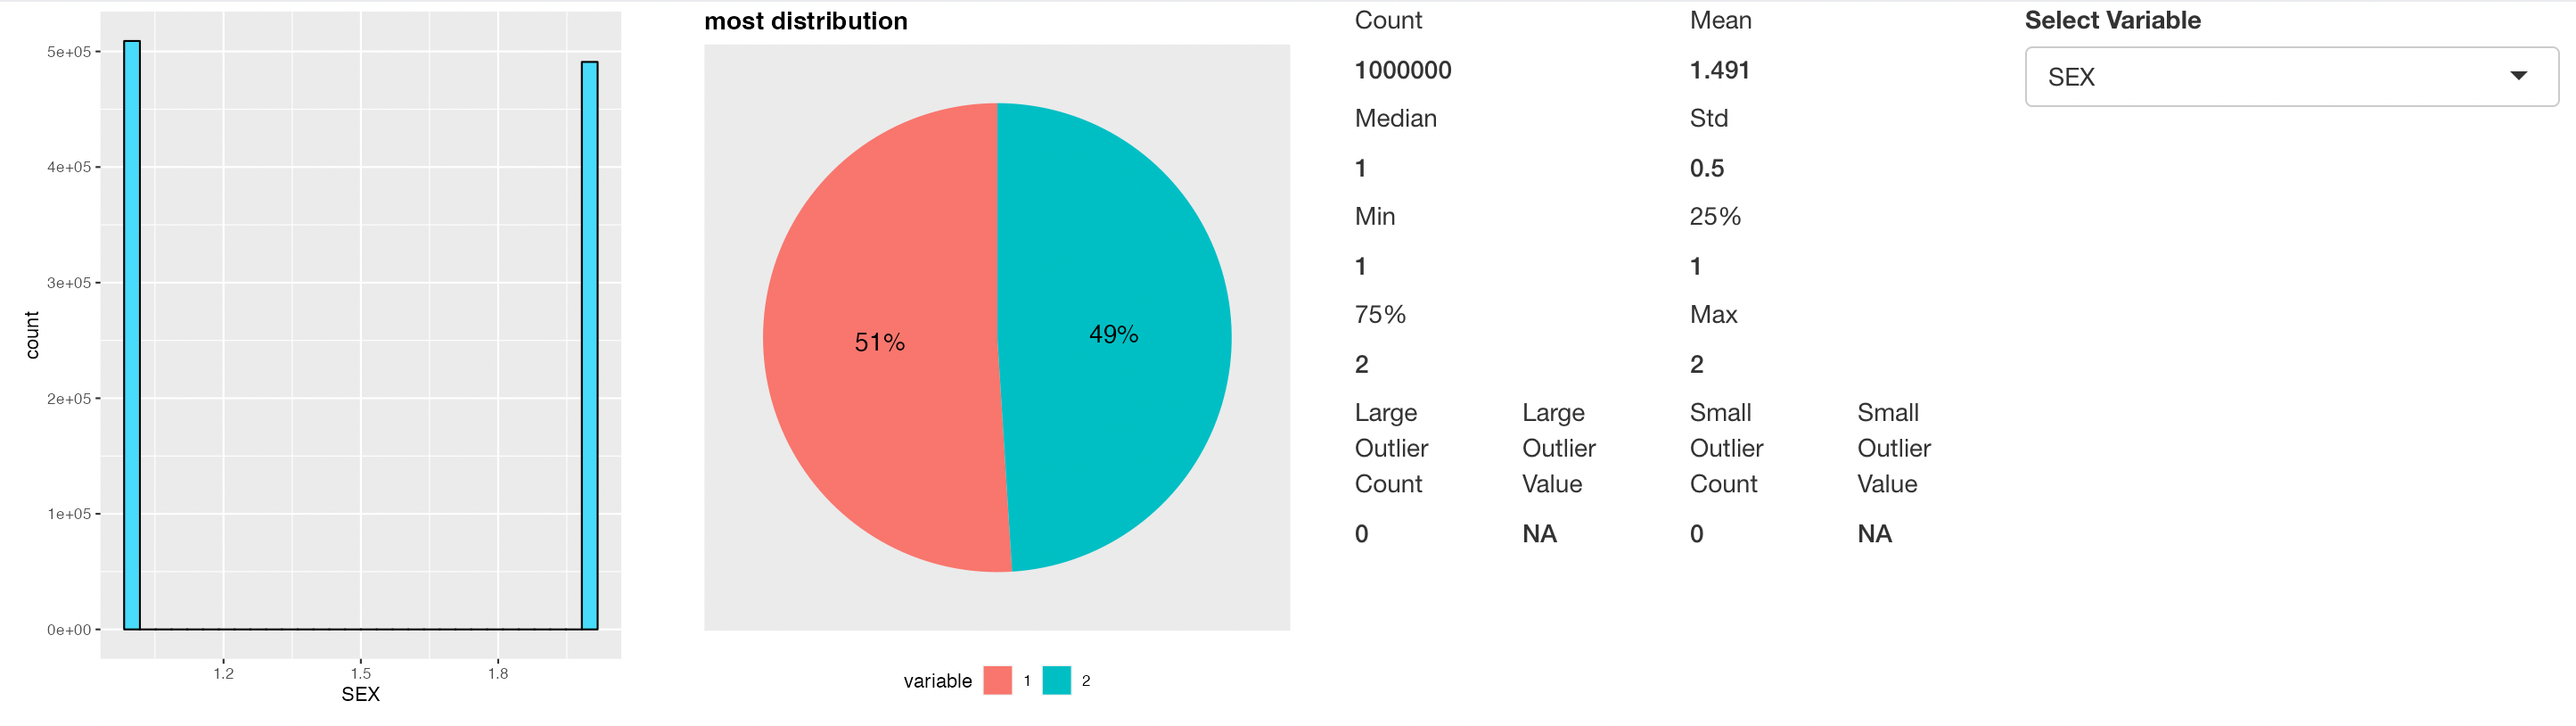
Note that, many of distributionModule’s function is effective with
Numeric value. So it will be better if you change data’s
type as expected (Sex could be better with
Factor not Numeric)
result will also be changed. (even it doesn’t have much )
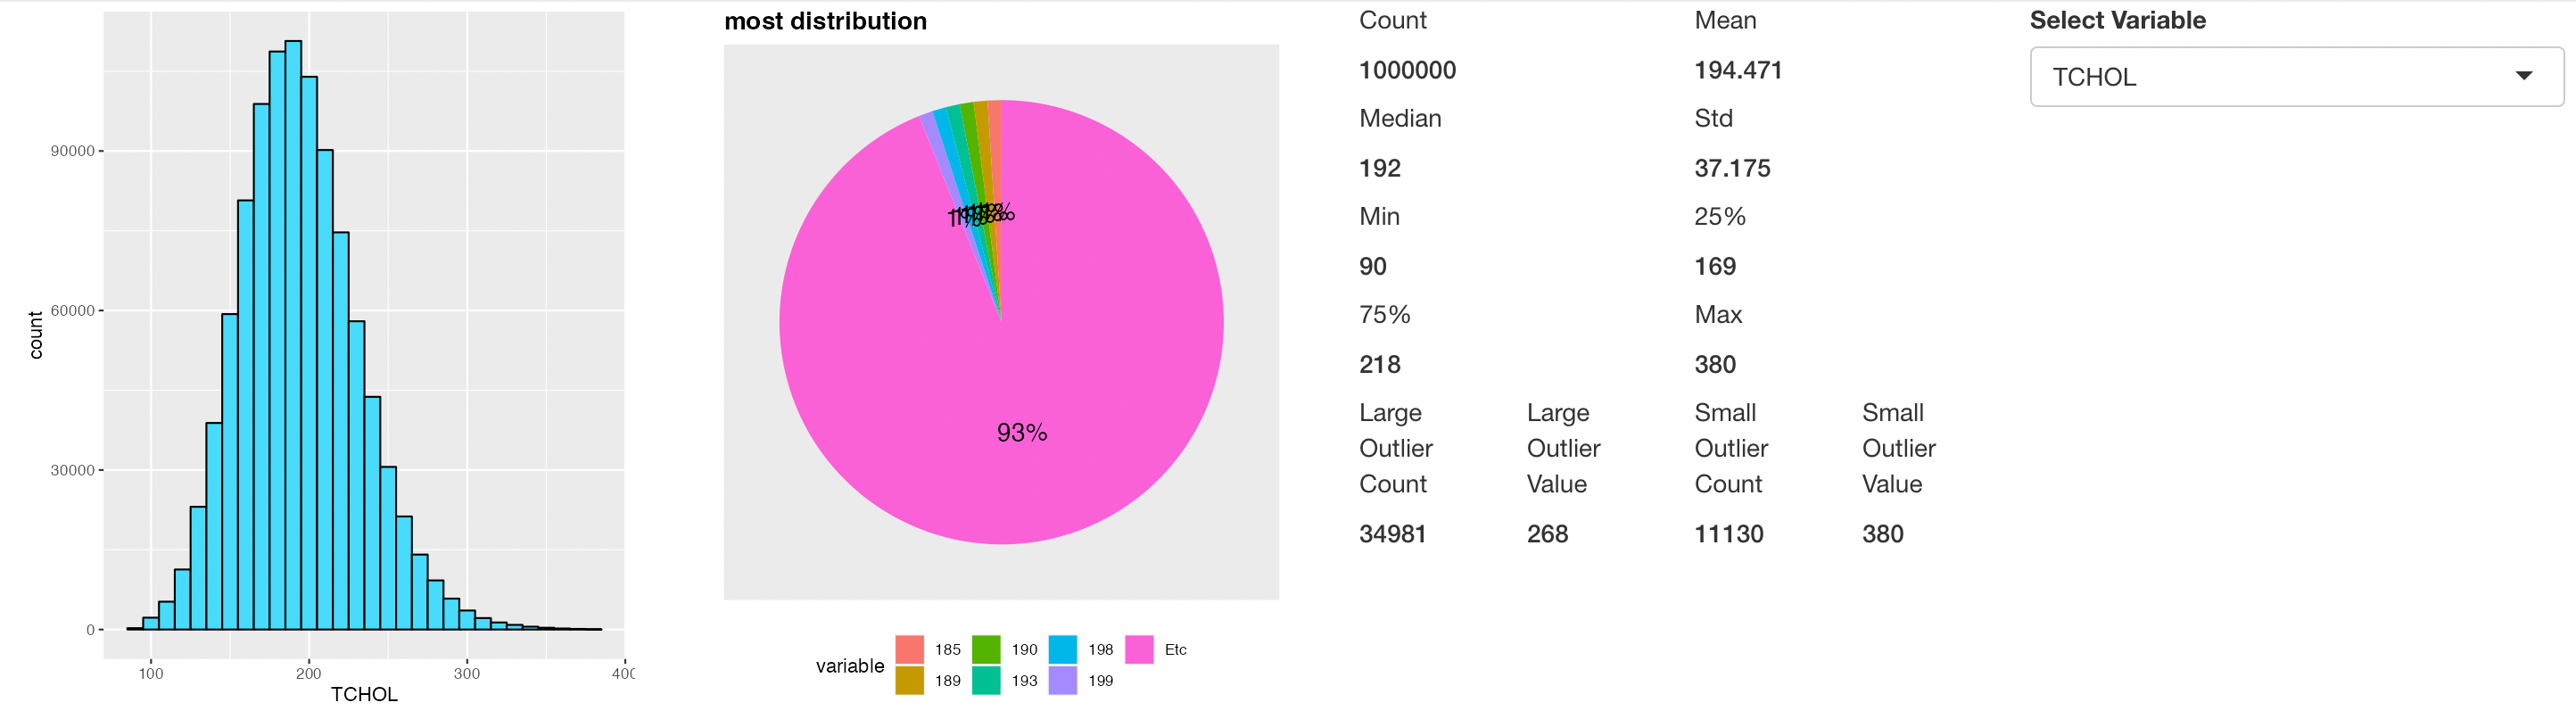
Description of statistics
If distribution uses Numeric variable,
It shows these statistics. ( see second figure )
- Count
- Mean
- Median
- Standard deviation (Std)
- Quantile values (0: Min, 25, 50: Median, 75, 100: Max)
- Outlier values
- value smaller than 288 may considered as outlier. which has 34891 count.
- value larger than 380 may considered as outlier. which has 11130 count.
For any issue or suggestion, please make issue in board’s github.